
Figure 7.
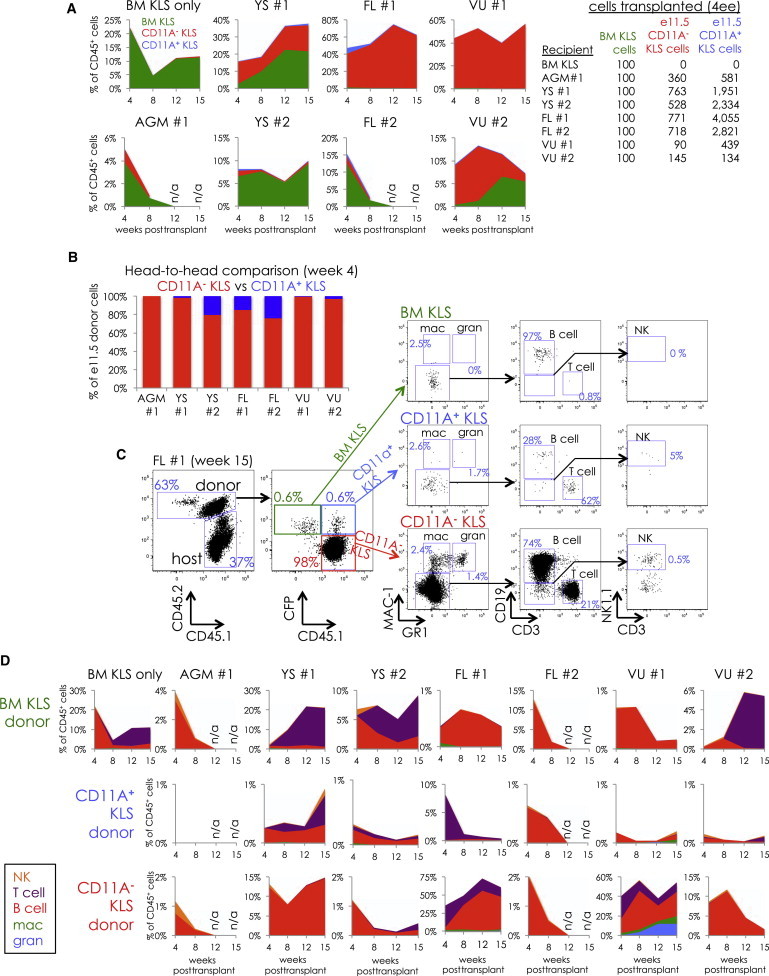
In Vivo Competitive Comparison of Engraftment and Lineage Potential of CD11A− and CD11A+ KLS
Newborn NSG mice were transplanted with four embryo equivalents of CD11A− KLS and CD11A+ KLS cells attained from different tissues at e11.5 along with 100 adult BM KLS cells. Blood was analyzed at 4, 8, 12, and 15 weeks to examine donor chimerism and lineages produced.
(A) Comparison of donor chimerism between BM KLS (green), CD11A− KLS (red), and CD11A+ KLS (blue). Stacked graphs show the distribution of donor cells in the blood at 4, 8, 12, and 15 weeks posttransplant, listed as a percentage of total CD45+ cells (including those of the recipient). The tissue of origin for e11.5 KLS cells is indicated above each graph. Note that the scale of the y axis is different in each graph. The number of CD11A− and CD11A+ KLS cells for each transplant is shown on the table on the right.
(B) Head-to-head comparison of e11.5 donor cells at 4 weeks. Only donor contributions of e11.5 CD11A− KLS (red) and CD11A+ KLS (blue) were compared.
(C) FACS analysis of donor lineages from e11.5 FL KLS cells (“FL #1”) at 15 weeks posttransplant. The percentage displayed for each lineage is out of that donor’s total cells. For example, the percentage of NK cells shown for CD11A− KLS cells is out of total donor CD11A− KLS-derived cells.
(D) Time course of the distribution of donor lineages derived from adult BM KLS (top row), CD11A+ KLS (middle row), and CD11A− KLS (bottom row) in the blood of recipient mice at 4, 8, 12, and 15 weeks posttransplant. Percentages shown are out of total CD45+ cells and shown for NK cells (orange), T cells (purple), B cells (red), macrophages (green), and granulocytes (blue). The gates used to identify each lineage are shown in (C). Note that the y axis scale is different with each graph.