Figure 2.

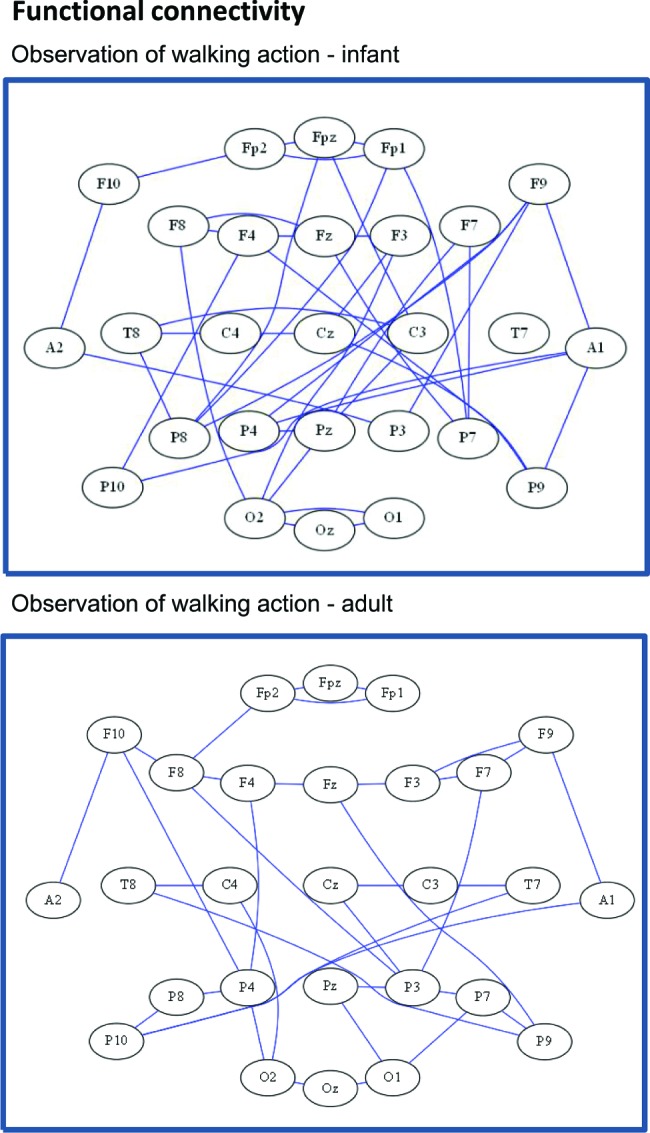
Representative functional connectivity headplot graphs from both an infant subject (top), and an adult subject (bottom), for the walking condition demonstrating differences in the topological organization of the network.

Representative functional connectivity headplot graphs from both an infant subject (top), and an adult subject (bottom), for the walking condition demonstrating differences in the topological organization of the network.