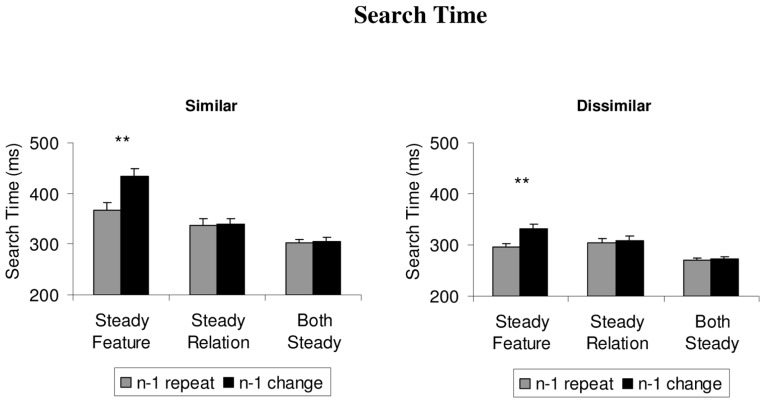
FIGURE 2.
The mean search times (from the onset of the search display to the first fixation on the target), depicted separately for similar and dissimilar colors in the steady features, steady relations, and both steady conditions. Feature priming effects are depicted as the difference between repeat trials (gray histograms) and switch trials (black histograms). Error bars depict +1 SEM. **p < 0.01.

