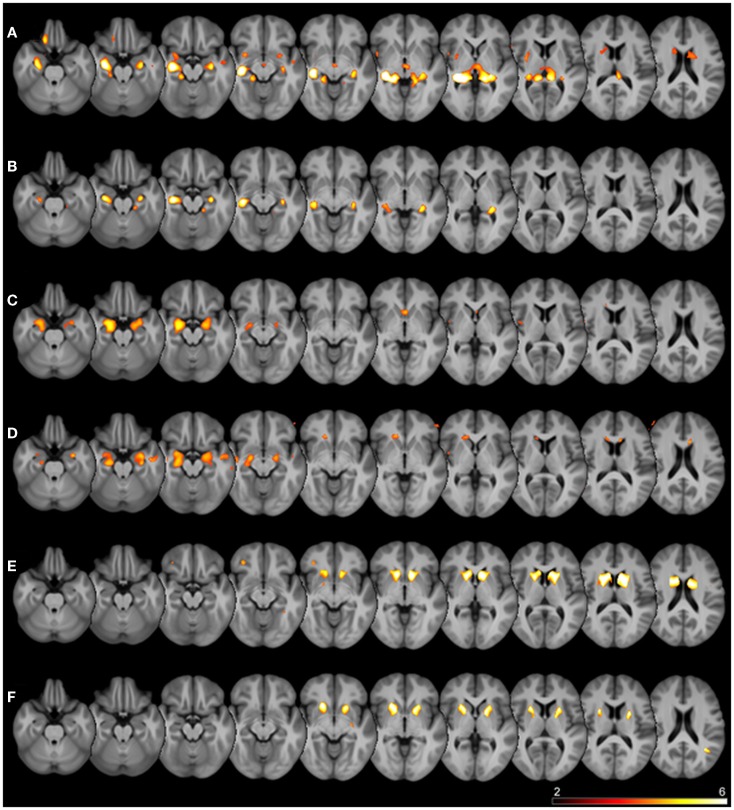
Figure 3.
Superimposed SPM results. Thresholded SPM results (uncorrected p < 0.0001) superimposed on the averaged T1-weighted images of all subjects are shown. The color scale represents SPM t-scores, images are in radiological convention (left in image is right in the subject). Rows are different seed regions: (A) left hippocampus, (B) right hippocampus, (C) left amygdala, (D) right amygdala, (E) left caudate nucleus, (F) left putamen.

