
Figure 2.
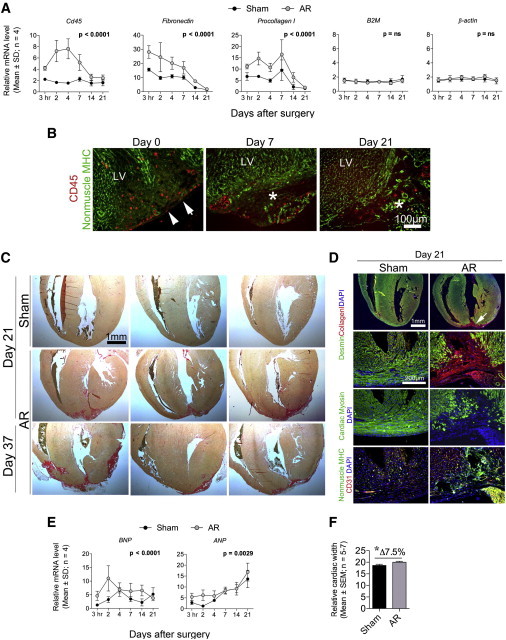
C57Bl/6 Hearts Become Substantially Fibrotic following AR and Show Signs of Hypertrophy
(A) Quantitative real-time PCR of sham and AR hearts (n = 4) at indicated time points. Statistical significance tested by two-way ANOVA is indicated.
(B and D) Paraffin- and cryo-embedded C57Bl/6 AR hearts (n = 4–8) were sectioned and immunostained for (B) CD45/nonmuscle myosin and (D) desmin/collagen; cardiac myosin; nonmuscle myosin/CD31. Representative images were processed (contrast/brightness and color balance) equally in Adobe Photoshop to enable merging. An asterisk (∗) indicates lesion area, whereas white arrows reflect the AR line.
(C) Sirius Red stainings of representative sham (n = 5) and AR (n = 11) heart sections from C57Bl/6 mice identify collagen disposition in the lesioned apex.
(E) Quantitative real-time PCR for hypertrophic markers (ANP and BNP) of sham and AR hearts (n = 4) at indicated time points.
(F) The relative width of C57Bl/6 hearts from sham and AR animals was measured at day 21. Significance was tested by a Student’s t test (∗p < 0.05).
For (A) and (E), quantitative real-time PCR raw data were normalized against B2M and β-actin, which were stably expressed as determined by the qBase+ platform (M:0.579 and CV:0.202) (Hellemans et al., 2007, Vandesompele et al., 2002).
See Figure S2 for quantitative real-time PCR profiling on gene programs at day 21 following AR.