
Figure 1.
FOXO3 Is Expressed in QSCs and Is Downregulated upon Activation
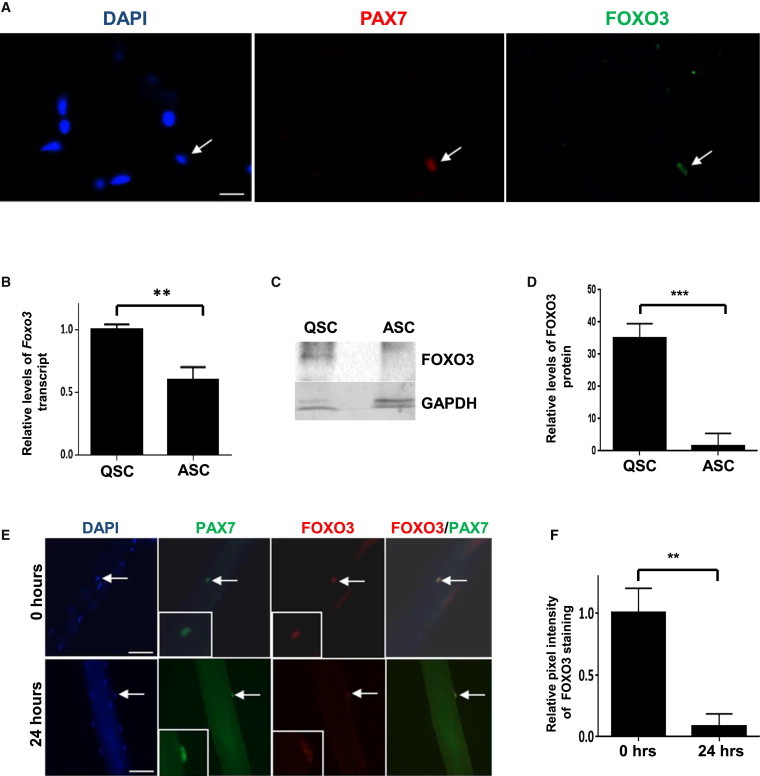
(A) Cryosections of uninjured tibialis anterior (TA) muscle contain PAX7+ve SCs that stain positive for FOXO3 (arrow).
(B) FACS-purified QSCs and ASCs from injured muscle isolated 2.5 days after injury were assessed for levels of Foxo3 transcript by qRT-PCR. Foxo3 transcript levels in ASCs are normalized to those in quiescence. QSC and ASC samples represent triplicate experiments of pooled RNA from two mice for each experiment (∗∗p < 0.01).
(C) A representative western blot analysis of lysates from FACS-purified QSCs and ASCs plated for 1 day in culture. Blots were probed with an antibody to FOXO3. FOXO3 protein levels are higher in QSCs compared to ASCs.
(D) The graph shows quantitative analyses of replicate blots of relative intensities of FOXO3 bands normalized to intensities of GAPDH for the corresponding sample. QSC and ASC samples represent triplicate experiments of pooled lysates from SCs sorted from two mice for each experiment (n = 3).
(E) Single myofibers with associated SCs were fixed either immediately after isolation (0 hr) or after 24 hr in culture and then immunostained for PAX7 and FOXO3. FOXO3 expression is reduced in SCs after 24 hr in culture compared to SCs at 0 hr. The insets in the lower left of the PAX7 and FOXO3 panels show high-magnification images of the SCs (indicated by the arrows) in the images. The FOXO3/PAX7 panels show merged images of PAX7 and FOXO3 staining, which show colocalization of the two proteins in the nucleus at 0 hr but that, at 24 hr, FOXO3 staining is much reduced.
(F) The graph shows the mean relative pixel intensities for nuclear FOXO3 staining at 0 hr and 24 hr that was quantified and expressed as a ratio after normalization with the pixel intensities for the corresponding PAX7 staining. There is a significant reduction in FOXO3 staining after 24 hr in culture (n = 10 myofibers per sample).
Scale bars represent 25 μm in (A) and 100 μm in (E).