
Figure 2.
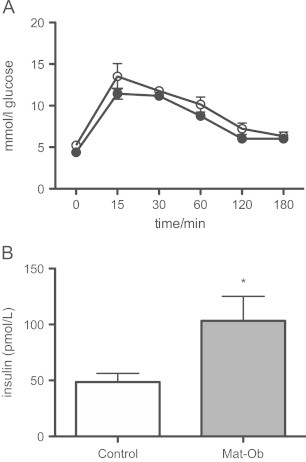
(A) Glucose tolerance following 1 g/kg body weight bolus i.p. glucose injection in Control (open circles) vs. Mat-Ob (closed circles) offspring; and (B) fasting serum insulin concentrations in Control (white bars) and Mat-Ob (grey bars) offspring. n=6 per group. ⁎=p<0.05 determined by student's t-test.