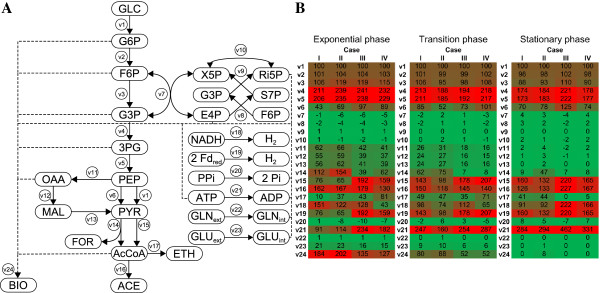
Figure 2.

Metabolic flux distribution of C. celer during glucose fermentation at different stages of growth. Reconstructed metabolic network of central carbon metabolism (A) and heatmap of metabolic fluxes normalized with respect to glucose uptake of 100 mmol (B). Stoichiometry for each reaction is defined in Table S1 (Additional file 1). Abbreviations: 3PG, 3-Phosphoglycerate; AcCoA, Acetyl-CoA; ACE, Acetate; ADP, Adenosine diphosphate; ATP, Adenosine triphosphate; BIO, Biomass; E4P, Erythrose-4-phosphate; ETH, Ethanol; F6P, Fructose-6-phosphate; Fdred, Reduced ferredoxin; FOR, Formate; G3P, Glyceraldehyde-3-phosphate; G6P, Glucose-6-phosphate; GLC, Glucose; GLN, Glutamine; GLU, Glutamate; H2, Hydrogen; MAL, Malate; NADH, Reduced nicotinamide adenine dinucleotide; OAA, Oxaloacetate; Pi, Orthophosphate; PPi, Pyrophosphate; PEP, Phosphoenolpyruvate; PYR, Pyruvate; Ri5P, Ribose-5-phosphate; S7P, Sedoheptulose-7-phosphate; X5P, Xylulose-5-phosphate.
