
Figure 1.
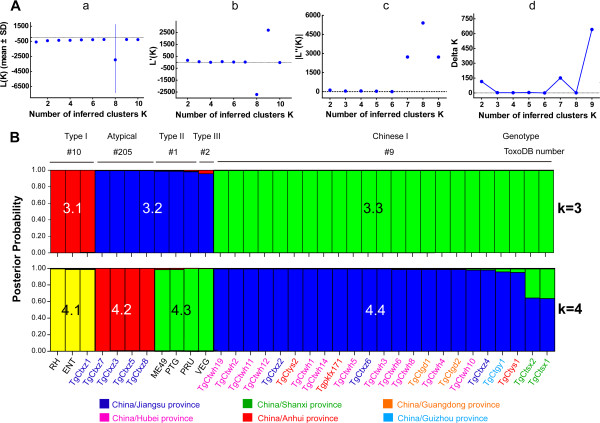
Clusters by STRUCTURE implemented with 15 microsatellite markers in Chinese T. gondii isolates. (A) Description of the four steps in detection of the true number of clusters K. Aa: L (K), plot of the mean likelihood, mean (± SD) of Ln P (D) over 3 runs for successive K values of 1 to 10; Ab: L’(K), plot of the mean difference between successive likelihood values of K, L’(K) = L (K) –L (K-1); Ac: | L”(K) |, plot of the absolute values of the average differences between successive values of L’(K), | L”(K) | = | L’(K + 1)- L’(K) |; Ad: Delta K (ΔK) = m | L”(K) | / s [L (K)], where m = means of the absolute values of L”(K), divided by the standard deviation of L (K). For Chinese T. gondii isolates, the optimal number of clusters was 3 according to the calculation of ΔK. (B) The population structure of Chinese isolates based on group sizes, K = 3 and K = 4. Colors represent a contribution from each presumed ancestral population (red, blue and green for Cluster C3.1, C3.2 and C3.3). Each strain was characterized by ToxoDB number, RFLP genotype and geographic location.