
Figure 7.
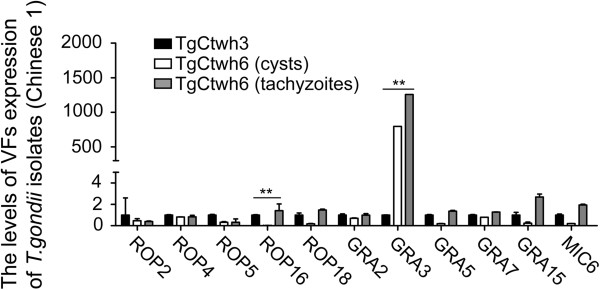
Gene expression profiles among the isolates with the same haplotype. It shows a significant increase of GRA3 expression in less virulent Wh6 and ROP16 in virulent Wh3. The qRT-PCR was performed in triplicate and values were reported as means with error bars indicating standard deviation. **P < 0.001.