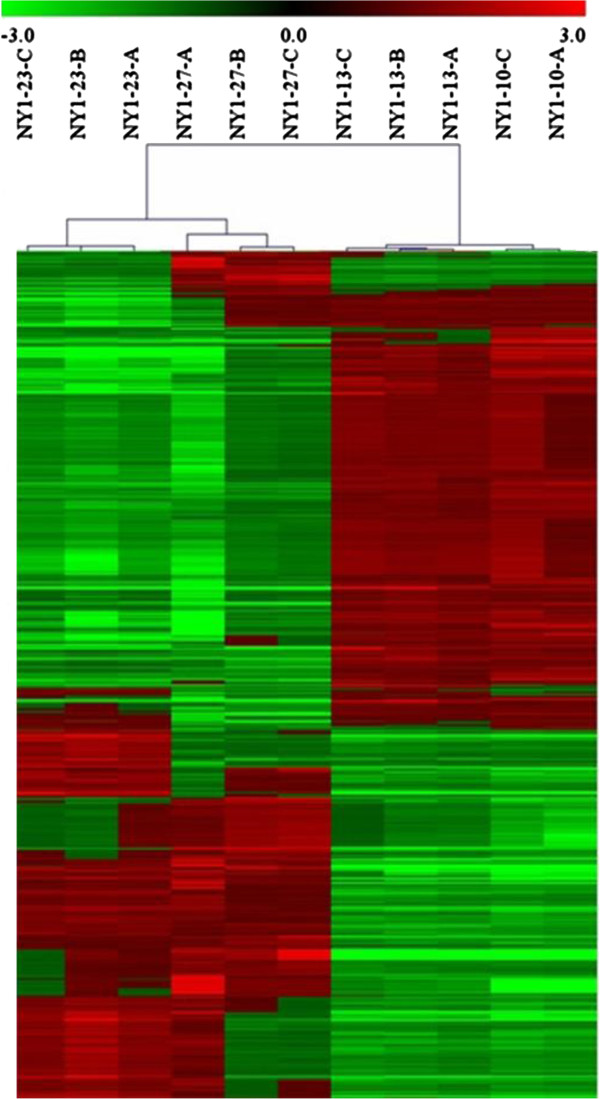
Figure 2.

Heat map of differentially expressed QPX transcripts. Hierarchical clustering of 1,580 QPX transcripts (Pearson’s correlation centered) identified to be differentially expressed at four temperature treatments by oligoarrays. The clustering of samples within each treatment (27°C, 23°C, 13°C, n = 3 and 10°C, n = 2) highlights the reproducibility of the assay.
