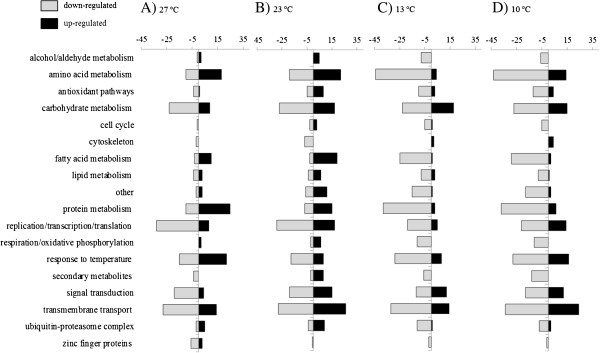
Figure 4.

Molecular processes affected by temperature treatments. Number of annotated QPX transcripts differentially expressed (DE) in response to four temperature treatments (A: 27 °C, B: 23 °C, C: 13 °C, D: 10 °C). Transcripts are grouped by their putative biological process and molecular function into 17 operational groups.
