
Figure 10.
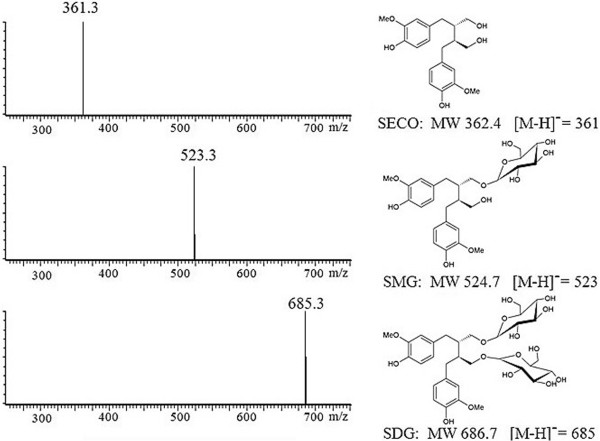
LC-ESI-MS spectra of UGT74S1 enzyme reaction products with SECO. The observed molecular weight for each metabolite (SECO, SMG and SDG) is shown next to its corresponding spectra. The expected molecular weights and [M-H]+ pseudomolecule ions are also shown under their respective structure.