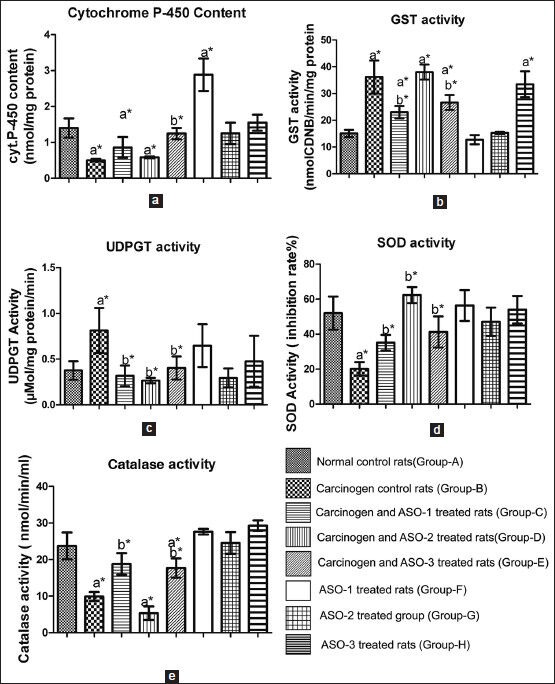
Figure 5.

Various enzyme activities, iso-enzyme level in hepatic tissues of the experimental rats, (a) cytochrome P-450 content, (b) glutathione S-transferase activity, (c) uridine diphosphate glucuronyl transferase activity, (d) superoxide dismutase activity, (e) catalase activity. Values represent mean ± standard deviation (n = 10), * P < 0.05, a s tatistical l evel o f s ignificance (using D unnett's t-test) when all groups were compared with Group-A, b statistical level of significance (using Dunnett's t-test) when Group-C, Group-D, and Group-E were compared with Group-B
