
Figure 2.
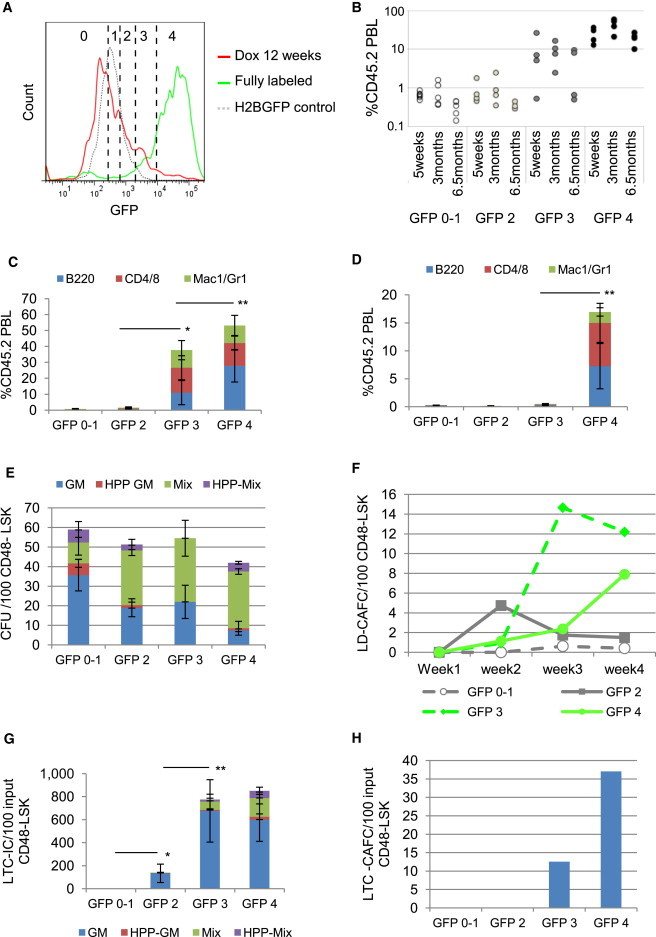
HSC Activity Correlates with Divisional History
(A) After 12 weeks chase, the LSK GFP histogram (red line) was divided into five fractions from low- to high-GFP retention. Prior to chase, 90% of LSK cells were in the GFP 3 and GFP 4 fractions (green line). Dotted gray line, H2BGFP control.
(B) Chimerism 5 weeks and 3 and 6.5 months posttransplantation of LSK cells isolated from each GFP level. One hundred cells from each fraction were transplanted into 4–6 SJL-recipient mice together with 200,000 SJL-competitor BM cells. Data are derived from one of two transplant experiments with consistent results. Each circle represents an individual mouse.
(C) Donor reconstitution to each lineage at 3 months after transplant. Mean ± SD; n = 4–6 mice.
(D) Donor reconstitution to each lineage at 3.5 months postsecondary transplantation of pooled BM (2 × 10⁶) from primary recipient mice from each GFP group from two transplant experiments. Three to five SJL mice were transplanted per group. Mean ± SD; n = 3–5 mice.
(E) cfu assay of LSKCD48− cells at each GFP level; colonies per 100 cells; mean ± SD; n = 3 separate cultures.
(F) LD-CAFC assay of LSKCD48− cells at each GFP level.
(G) LTC-IC assay of LSKCD48− cells at each GFP level; cfus were normalized to the amount derived from 100 cells initiating the LTC. Mean ± SD; n = 3 separate cultures.
(H) LTC-CAFC assay of LSKCD48− cells at each GFP level; frequency of CAFCs was normalized to the amount derived from 100 cells initiating the LTC.
Significance of donor contribution to total PBL (C and D) and of total colony numbers (G) by Student’s t test; ∗p < 0.05; ∗∗p < 0.01. See also Figure S2.