
Figure 6.
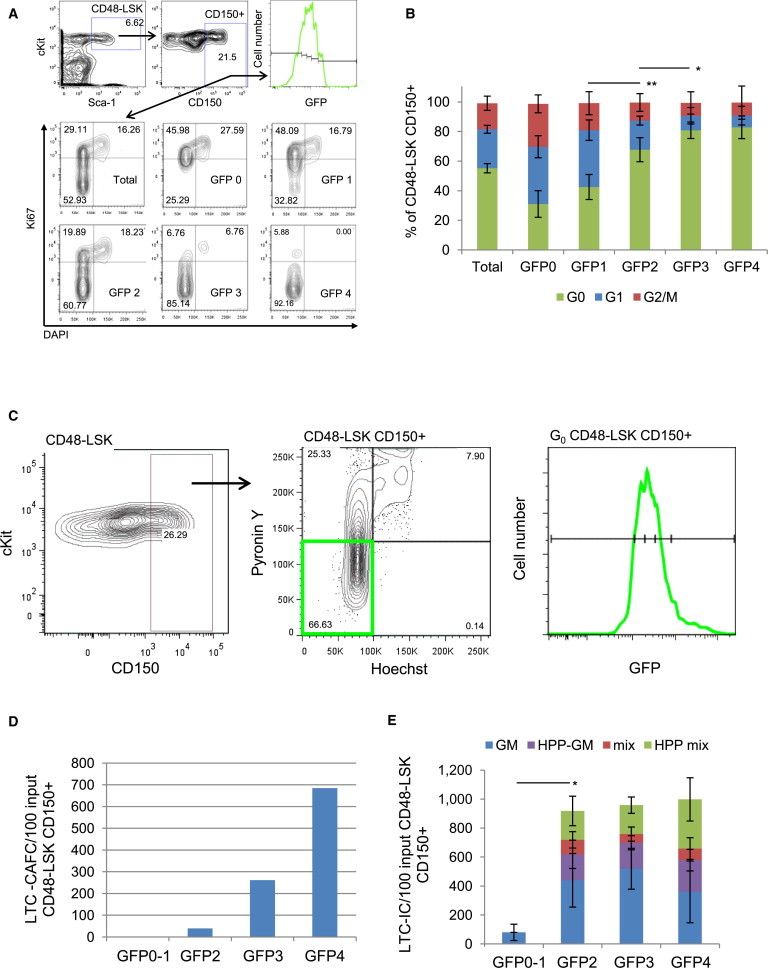
Cell-Cycle Analysis and Functional Activity of G0 LSKCD48−CD150+ Cells throughout the GFP Dilution Cascade
(A) Cell-cycle profiles of total LSKCD48−CD150+ cells or those at GFP 0, GFP 1, GFP 2, GFP 3, and GFP 4 by DNA content (DAPI) versus Ki67 staining. Cell-cycle phases were determined as G0 Ki67lowDAPI2N, G1 Ki67hiDAPI2N, S/G2/M Ki67hiDAPI > 2N-4N.
(B) Percentage of G0, G1, and S/G2/M cells in total LSKCD48−CD150+ and those at GFP 0, GFP 1, GFP 2, GFP 3, and GFP 4 as determined by Ki67/DAPI staining (mean ± SD; n = 4 mice). Significance of G0 cells determined by Student’s t test; ∗p < 0.05; ∗∗p < 0.01.
(C) Isolation of viable G0 LSKCD48−CD150+ cells after 12 weeks chase for in vitro assays. LSKCD48−CD150+ cells were sorted first, followed by Py/Ho staining. G0 cells (PylowHo2N lower left quadrant) were isolated and separated into GFP 0, GFP 2, GFP 3, and GFP 4 subfractions.
(D) LTC-CAFC assay of G0 LSKCD48−CD150+ cells at each GFP level.
(E) LTC-IC assay of G0 LSKCD48−CD150+ cells at each GFP level. Significance of total colonies determined by Student’s t test; ∗p < 0.05; mean ± SD; n = 3 separate cultures.