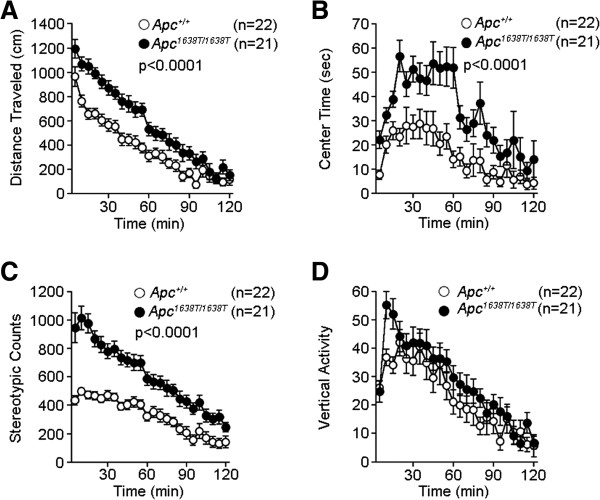
Figure 1.
Increased locomotor activity in open field test in Apc1638T/1638T mice. (A) Distances traveled (genotype effect, F1,41 = 22.58, p < 0.0001; genotype × time interaction, F23,943 = 2.909, p < 0.0001), (B) time spent in the center of the compartment (genotype effect, F1,41 = 18.699, p < 0.0001; genotype × time interaction, F23,943 = 1.664, p = 0.0258), (C) counts of stereotypic behavior (genotype effect, F1,41 = 41.58, p < 0.0001; genotype × time interaction, F23,943 = 5.233, p < 0.0001), and (D) counts of vertical activity were recorded. The p values in the figure indicate genotype effect in two-way repeated measures ANOVA. Error bars indicate SEM.

