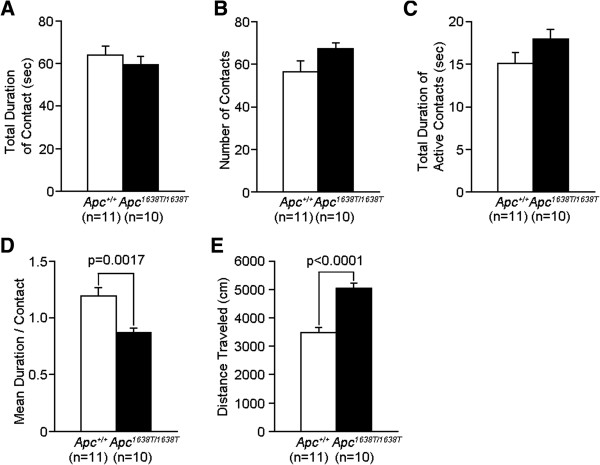
Figure 3.
Mildly decreased social interaction behaviors in a novel environment in Apc1638T/1638T mice. (A) Total duration of contacts, (B) number of contacts, (C) total duration of active contacts, (D) mean duration of each contact, and (E) total distance traveled were recorded. The p values indicate genotype effect in one-way ANOVA. Error bars indicate SEM.

