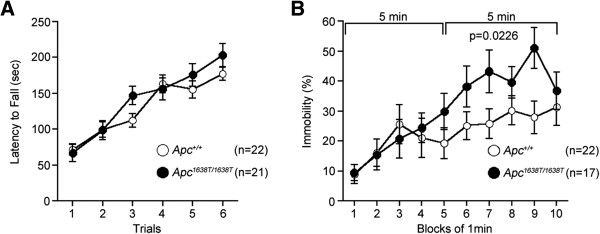
Figure 4.

Mildly increased depression-like behaviors in Apc1638T/1638T mice. (A) Rotarod test: latencies to fall from the rotating drum across training sessions were recorded. (B) Tail suspension test: immobility time is presented as the percentage of time in each block (5–10 min, genotype effect, F1,37 = 5.663, p = 0.0226). The p value in the figure indicates genotype effect in two-way repeated measures ANOVA. Error bars indicate SEM.
