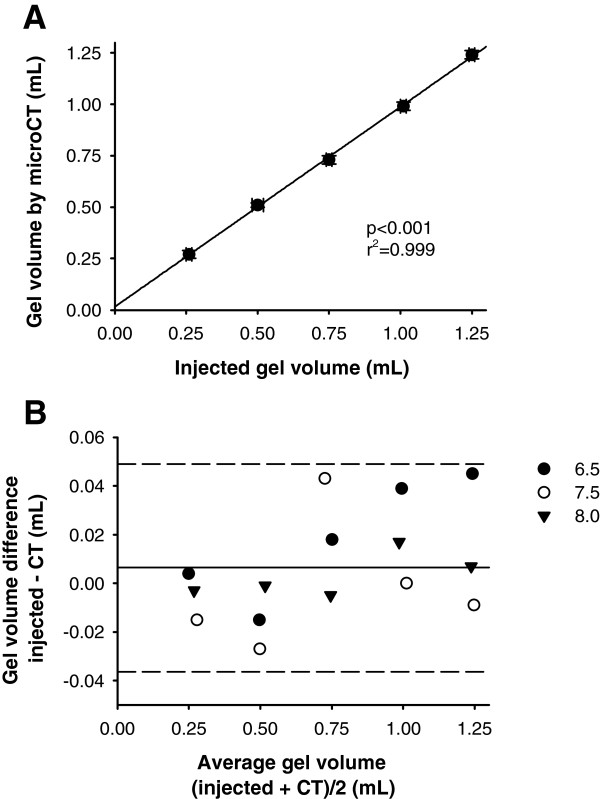
Figure 1.
MicroCT scan precision and accuracy in bench tests simulating the presence of secretions within ETTs. Correlation between the amount of injected gel, simulating the secretions present at extubation, and the volume of gel measured by MicroCT scan (panel A). The Bland-Altman plot shows good precision in MicroCT scan assessment of volume of injected gel (average difference 0.006, 95%CI −0.036 to 0.049 mL, panel B). Symbols represent different ETT sizes (mm of internal diameter).

