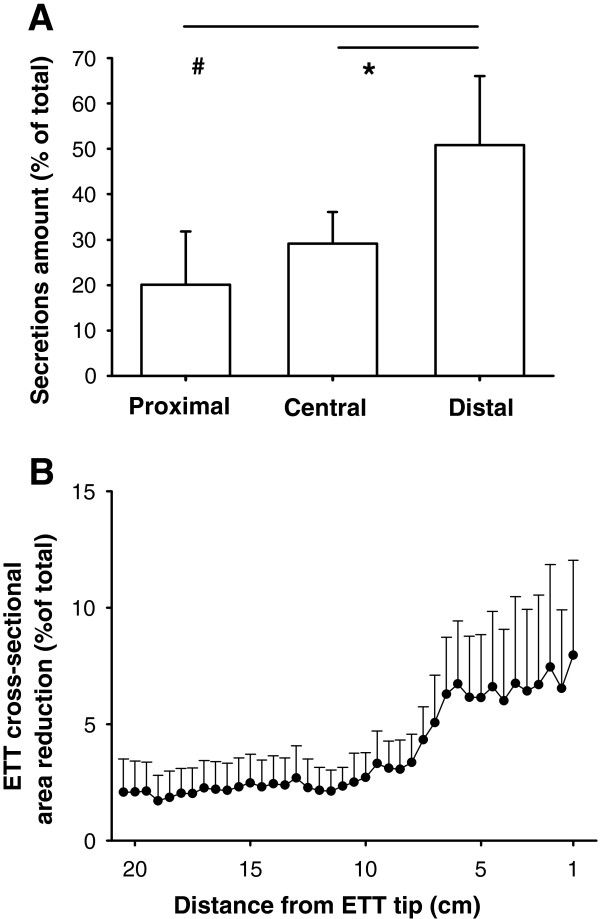
Figure 3.
Distribution of secretions within the ETT. Secretions volume distribution within the 11 studied ETTs is not homogeneous (panel A), resulting higher in the distal portion (tip side). Correspondingly, the average cross-sectional area reduction tends to increase close to the ETT tip (panel B).

