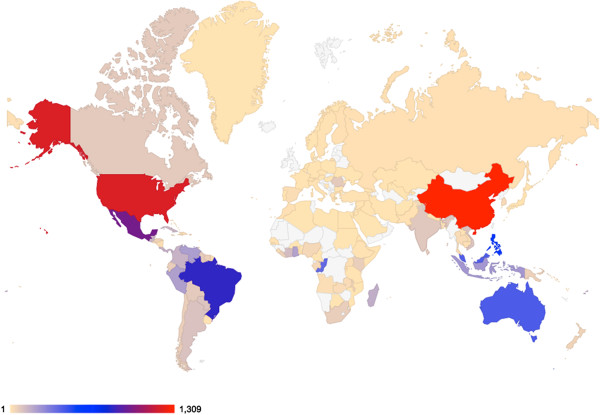
Figure 2.

Geographic distribution of source specimens in the public collections of ClearedLeavesDB. Each country’s color denotes the number of specimens for which images are available in the database as of submission. The world map projection is via Google geo chart: https://code.google.com/apis/ajax/playground/?type=visualization#geo_chart.
