Fig. 3.
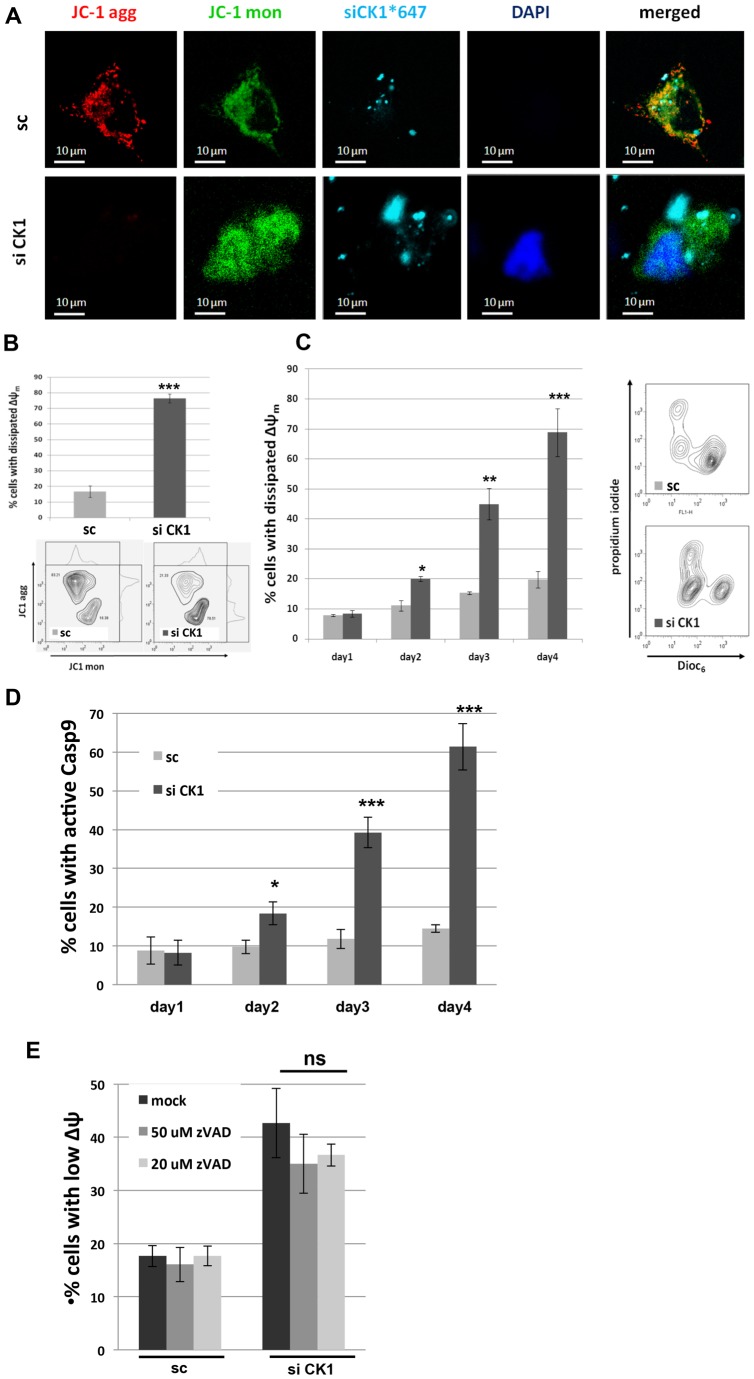
Downregulation of CKMT1 results in ΔΨm dissipation and caspase 9 activation. (A) Confocal live-cell imaging using JC1 as an indicator of mitochondrial membrane polarization at 96 h post transfection with siRNA against CKMT1 (siCK1) in HeLa cells. Note that 4′,6-diamidino-2-phenylindole (DAPI) is not cell permeable in viable cells, whereas it enters apoptotic cells. Mon, monomer; agg, aggregate. (B) FACS analysis of mitochondrial membrane polarization using JC1 at 96 h post transfection with siCK1 or a scrambled control sequence (sc). Representative ratiometric contour plots are shown. (C) Kinetics of mitochondrial depolarization after the downregulation of CK1 by siRNA, as monitored by DiOC6 and PI co-staining and subsequent FACS analysis. Representative multiparametric contour plots are shown on the right. (D) Caspase 9 activation was assessed by live-cell staining with CaspaTag9 and subsequent FACS analysis. (E) HeLa cells were transfected with siCK1 or sc and treated with the indicated concentrations of zVAD at 24 h and 48 h post transfection. The ΔΨm was assessed by using DiOC6 staining and subsequent FACS analysis. Data show the mean±s.d. of three independent experiments. *P<0.05; **P<0.01; ***P<0.001; ns, not significant (Student's t-test).

