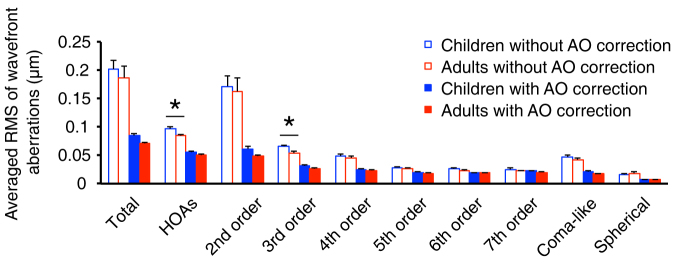
Figure 1. Average root mean square (RMS) value of Zernike coefficients with and without adaptive optics (AO) correction.

Average RMS value of wavefront aberrations was provided up to 7th order. In all conditions, un-filled bars represent results that were measured without AO correction; filled bars represent results that were measured with AO correction; blue bars represent results of children (n = 6) and red bars represent results of adults (n = 5). Error bars represent standard errors of RMS value across subjects. ‘*' represents p < 0.05 by a two-tailed Independent Samples t-test.
