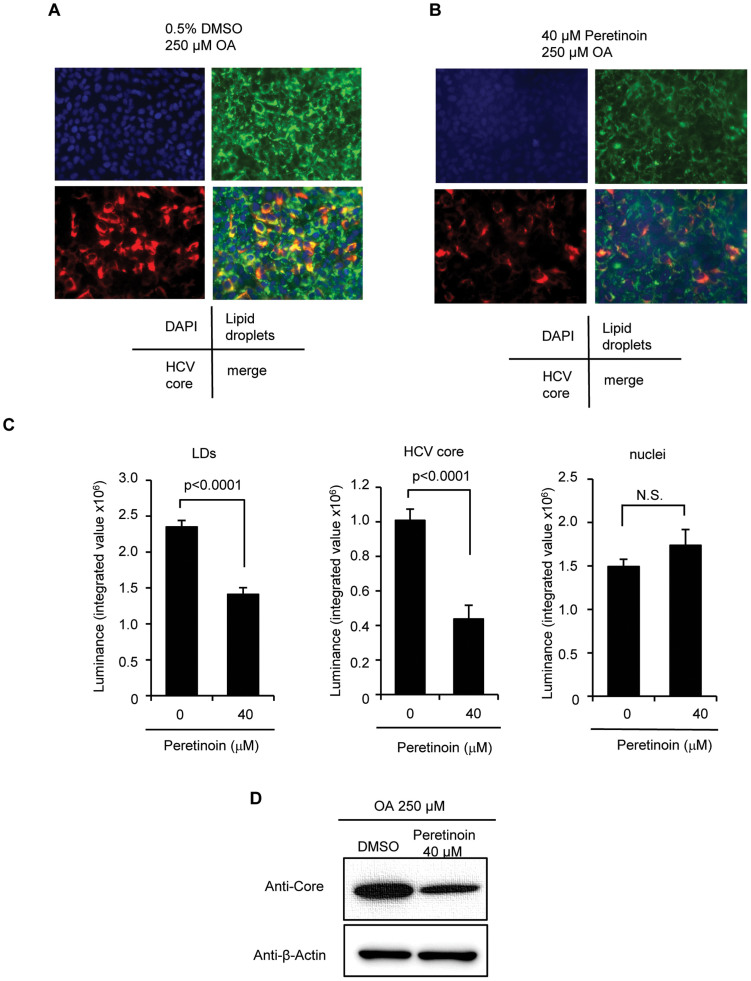
Figure 3. Reduction of LD signals by Peretinoin.
Huh-7.5 cells were infected with HJ3-5 virus at an MOI of 1, and 72 h later, 250 μM OA and DMSO or 250 μM OA and 40 μM Peretinoin were added, and the following assay was performed at 72 h later. (A, B) At 72 h later, the cells were fixed and stained for nuclei, LDs, and HCV core protein. (A) Shows 250 μM OA and DMSO-treated cells and (B) shows 250 μM OA and 40 μM Peretinoin-treated cells. The photos in (A) and (B) were taken under exactly the same conditions. (C) The signal intensity from LDs, HCV core protein, and nuclei was quantitated as described in the Methods. Data shown represent mean signal intensity ± SD from 4 different areas, and the difference was analysed statistically using Student's t-test. (D) Cell lysates were collected and subjected to western blot analysis using anti-core protein and anti-β-actin antibodies. Full-length blots/gels are presented in Supplementary Fig. S6 online. N.S., not significant.

