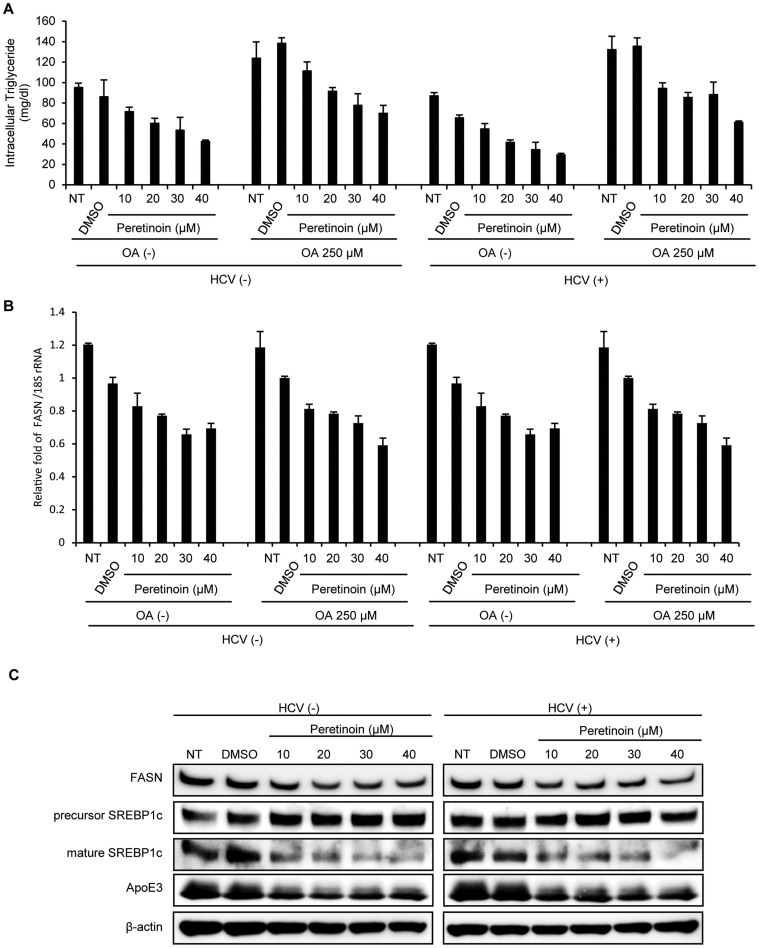
Figure 4. Mechanism by which Peretinoin alters lipid metabolism.
Huh-7.5 cells were transfected with H77S.3/GLuc2A RNA, and 72 h later, the transfected cells, depicted as ‘HCV(+)', and non-transfected Huh-7.5 cells, depicted as ‘HCV(-)', were treated with or without 250 μM OA in the presence of 2% fatty acid-free BSA with 0.5% DMSO or 10–40 μM Peretinoin, and the following assay was performed at 72 h later. (A) The concentration of intracellular TGs was measured. Data shown represent mean concentration ± SD from 3 independent experiments. (B) RNA was extracted and the levels of FASN mRNA and 18S rRNA were quantitated by RTD-PCR. FASN levels were normalised to those of 18S rRNA, and the ratio was furthermore normalised to that from DMSO-treated cells. The results presented here represent the relative fold of FASN/18S rRNA ± SD from 3 independent experiments at the indicated conditions. (C) Lysates from the cells without OA treatment were collected and subjected to western blot analysis using anti-FASN, anti-precursor SREBP1c, anti-mature SREBP1c, anti-ApoE3, and anti-β-actin antibodies. Full-length blots/gels are presented in Supplementary Fig. S7 online.

