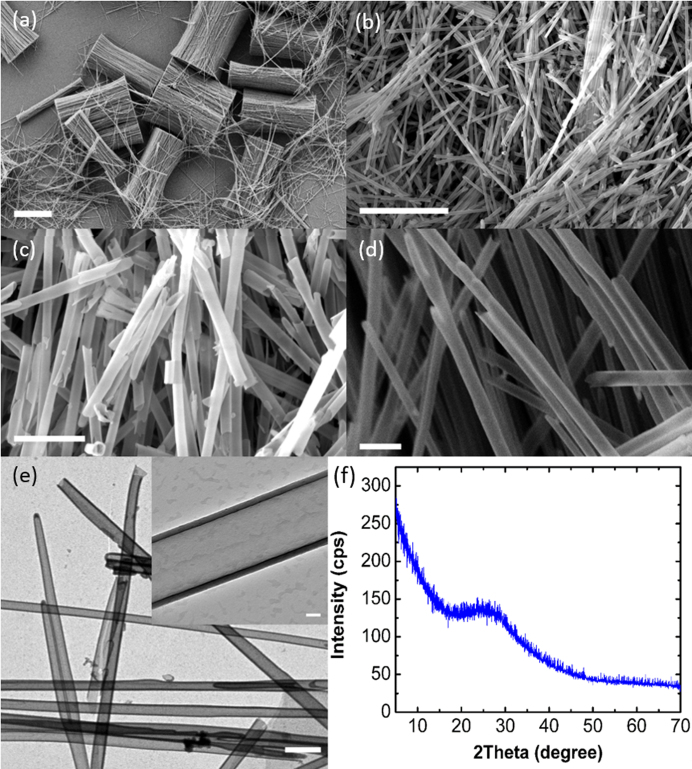
Figure 2.
SEM image of (a) partially separated SiO2 NTs showing NT bundles and dispersed NTs, (b) fully separated dispersed SiO2 NTs, (c) separated SiO2 NTs showing tubular morphology, and (d) image showing branched morphology. Scale bars are 25 μm, 10 μm, 2 μm, and 1 μm for (a), (b), (c), and (d), respectively. (e) TEM image of dispersed SiO2 NTs and inset showing tube diameter and wall thickness. Scale bar is 400 nm and 50 nm for the inset. (f) XRD analysis of SiO2 NTs.

