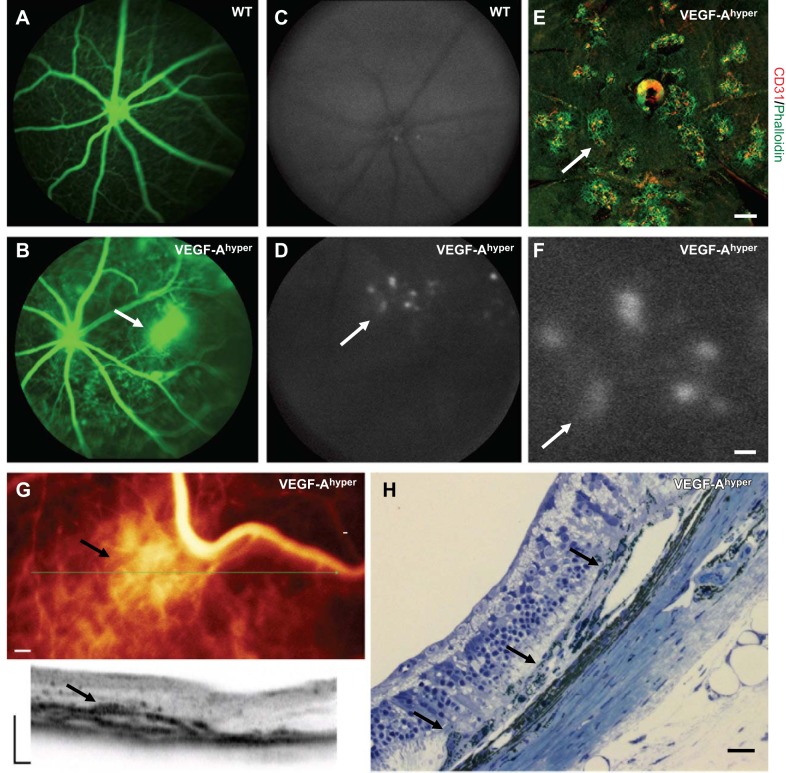
Figure 2.
Fundus imaging in VEGF-Ahyper mice shows CNV resembling findings in neovascular AMD. A, B) Fluorescence angiography shows a neovascular lesion (B, arrow) with fluorescein leakage in a 6-mo-old VEGF-Ahyper mouse, which is not observed in WT control littermate mice (A). C, D) Increased multifocal fundus autofluorescence (arrow) is noticed in VEGF-Ahyper mice (D), but not in WT control mice (C). E) Multifocal CNV lesions (arrow) can be seen in choroidal flat-mount stainings in VEGF-Ahyper mice. CNV lesions show strong staining for neovessels with CD31 (red) at sites of RPE barrier breakdown (phalloidin, green). F) Higher magnification of fundus image shown in D (arrows indicate same lesion with increased fluorescence). Area of increased fluorescence is about the same size as CNV lesions observed by choroidal flat-mount staining (as in E). G) OCT imaging of the fundus of a 10-mo-old VEGF-Ahyper mouse shows a CNV lesion (arrow). Representative image section through this lesion is shown (plane of section through green line indicated, arrow), while adjacent RPE/retina appear normal. H) The in vivo OCT findings reflect the histological findings in these mice that show neovascular CNV membranes with RPE abnormalities (arrows). Scale bars = 200 μm (E–G); 20 μm (H).

