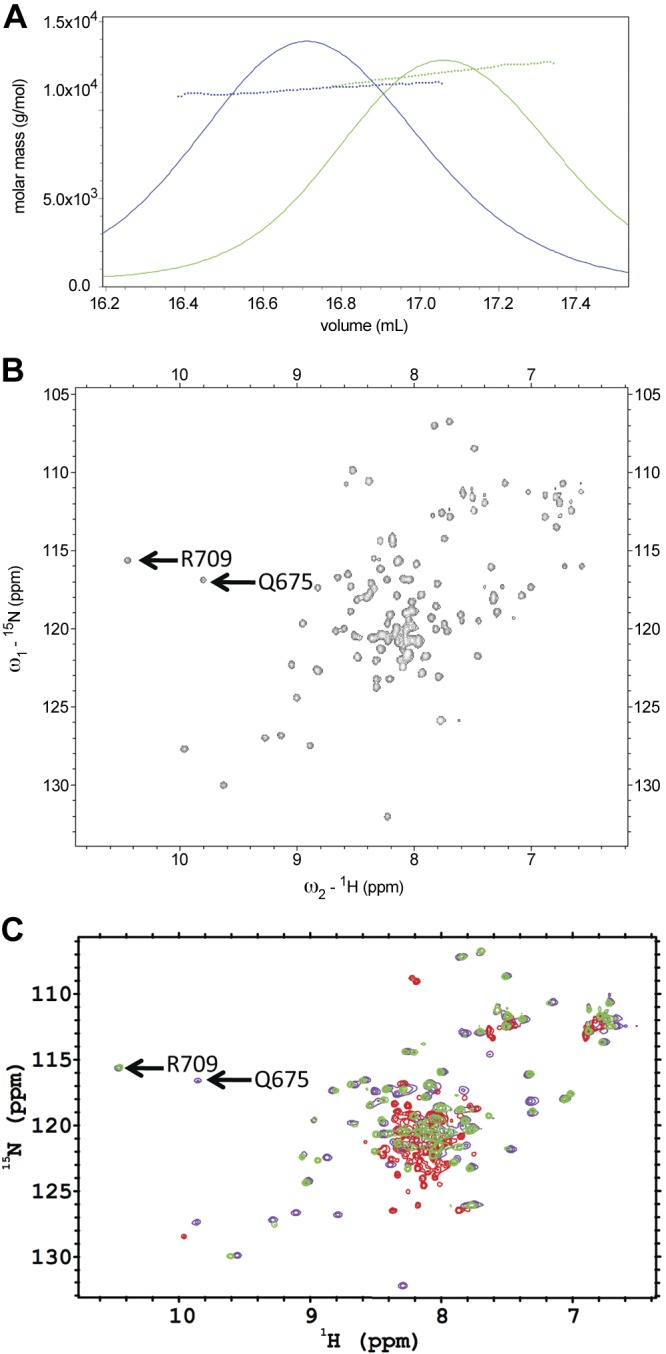
Figure 2.

SEC-MALS and NMR spectra of PC2 proteins. A) SEC-MALS analysis of suPC2-EF (12.7 kDa, green trace) and hPC2EF (11.4 kDa, blue trace) indicate that both proteins are monomeric in 25 mM TRIS (pH 7.4), 150 mM KCl, 1 mM Ca2+, and 1 mM TCEP buffer. B) 1H-15N HSQC spectra of 15N suPC2-EF at 600-MHz proton frequency. Arrows indicate Q675 and R709 residues that show shifts due to the amide protons involved in hydrogen bonding with the side-chain carboxyl oxygen atom of the corresponding aspartate residue at the +X position of the individual EF hand motifs. C) Overlaid 1H-15N HSQC NMR spectra of 15N suPC2EF-1 protein under various solvent conditions collected at 25°C. Violet contours depict data from a sample with a protein concentration of 450 μM with 2 mM TRIS (pH 7.4), 150 mM NaCl, 1 mM TCEP, and 20 mM CaCl2. Green contours depict data collected on a sample with 87 μM protein under similar solvent conditions, but without added CaCl2; whereas red contours depict data collected on a sample with 70 μM protein under similar solvent conditions without added CaCl2 and with 200 μM 5, 5′-dimethyl BAPTA to bind residual calcium found in the buffer.
