Figure 8.
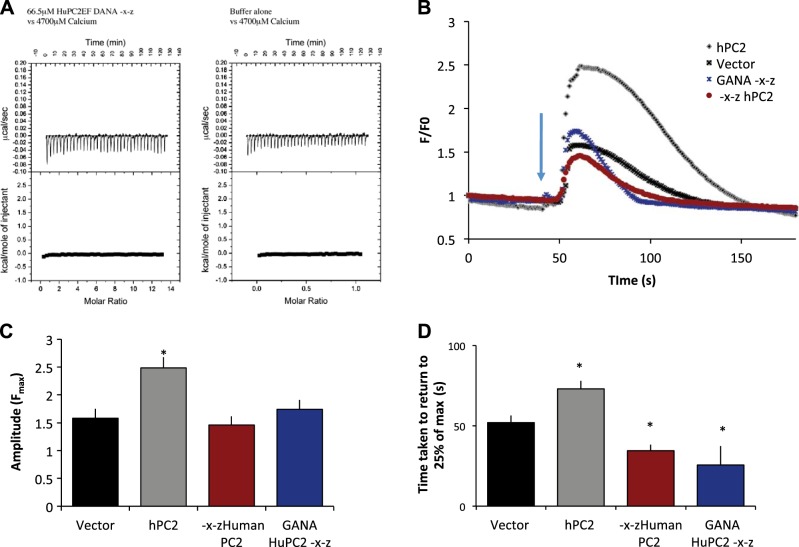
The first EF hand cannot bind Ca2+ in the absence of the second EF hand. A) Titration of 66.5 μM huPC2-EF DANA-X-Z or buffer alone (25 mM TRIS, 150 mM KCl, and 1 mM TCEP, pH 7.4) against 4.7 mM Ca2+. B) Ca2+ transients elicited after the addition of 100 nM vasopressin (blue arrow). LLC-PK1 cells were transfected with empty vector (gray) PC2 (black), hPC2-X-Z (red), or hPC2-GANA-X-Z (blue). Traces represent mean data, n = 8–22, where n represents number of cells from ≥2 independent experiments. C) Average amplitude responses. D) Average time taken for the transient to return to 25% of the maximum amplitude; n = 8–22, where n represents number of cells from ≥2 independent experiments. *P < 0.05 vs. vector.

