Figure 2.
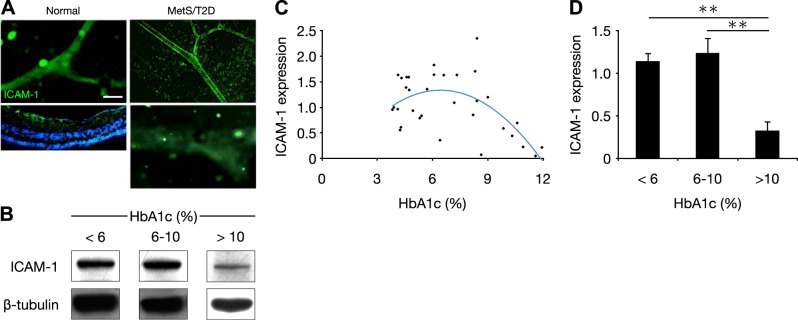
Dynamic of ICAM-1 expression in retinas of NGR. A) Immunohistochemistry for ICAM-1 in retinal vessels of normal (<6% HbA1c, left) and diabetic NGR (6–10% HbA1c, top right), and late stage disease (>10% HbA1c, bottom right micrograph) Scale bar = 50 μm. B) Representative Western blot bands for ICAM-1 and β-tubulin in normal (<6%), diabetic (6–10%), and late-stage (>10% HbA1c) diabetic animals. C) Distribution of retinal ICAM-1 expression in relation to plasma HbA1c. D) Quantitative analysis of Western blots of retinal ICAM-1 in normal (<6%), diabetic (6–10%), and late-stage (>10% HbA1c) diabetic animals. Standardization was determined as the ratio of the ICAM-1 band densities through the respective β-tubulin internal control bands. **P < 0.01.

