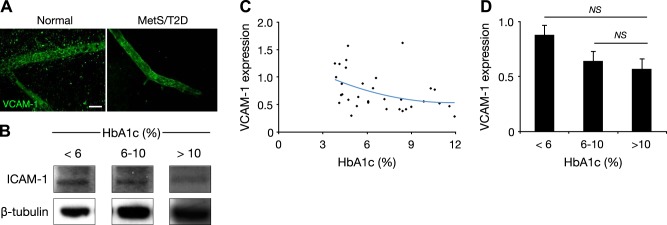
Figure 3.

Unchanged VCAM-1 in retinas of NGRs. A) Immunohistochemistry for VCAM-1 in retinal vessels of normal (<6% HbA1c) and diabetic NGRs (6–10% HbA1c). Scale bar = 30 µm. B) Representative Western blot bands for VCAM-1 and β-tubulin in normal (<6%), diabetic (6–10%), and late-stage diabetic (>10% HbA1c) animals. C) Distribution of retinal VCAM-1 expression in relation to plasma HbA1c. D) Quantitative analysis of retinal VCAM-1 in normal (<6%), diabetic (6–10%), and late-stage diabetic (>10% HbA1c) animals. NS, not significant.
