
Figure 2.
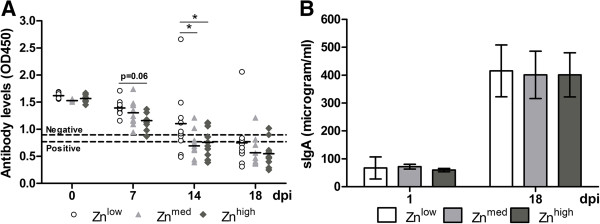
Development of systemic and mucosal immune responses after TGEV infection. (A) TGEV-specific antibodies measured by competitive ELISA are shown as optical densities (OD), measured at 450 nm, from 0 to 18 dpi. An OD450 value higher than 0.9 was considered negative (upper dashed line), an OD450 value lower than 0.77 was considered positive (lower dashed line), and an OD450 value between 0.9 and 0.77 was considered questionable. (B) The concentration of sIgA in intestinal wash fluid was measured by a direct ELISA. Results are shown as the mean value ± standard deviation. Asterisk indicates statistically significant difference (P ≤ 0.05) between the groups.