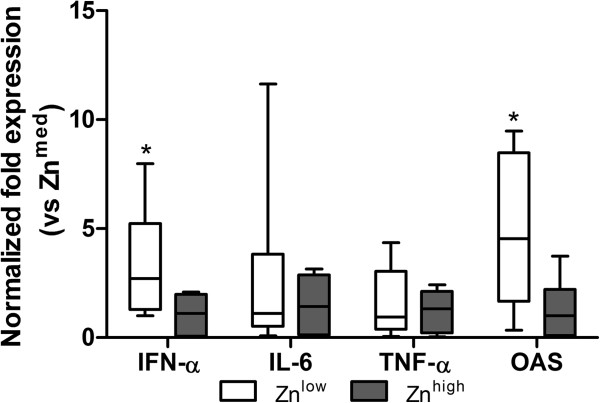
Figure 3.

Cytokine expression in intestinal tissues of Zn-treated piglets at 1 dpi. The expression of selected cytokines was assessed by quantitative RT-PCR. The expression of IFN-α and OAS was significantly increased in the Znlow compared to the Znhigh group. Boxes indicate medians (n = 10) (horizontal lines) and the lower and upper quartiles (bottoms and tops of boxes). The vertical bars in the box plots indicate the minimal and maximal values recorded. Asterisk indicates statistically significant differences (P ≤ 0.05) between Zn treatment groups.
