Figure 4.

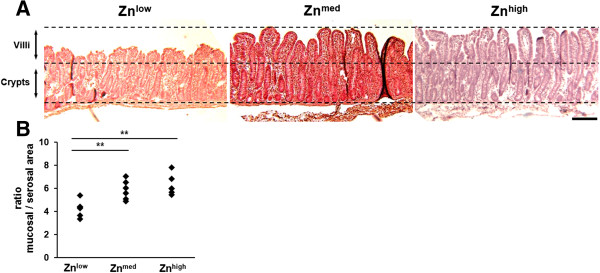
Morphometrical analysis of jejunal tissue at 1 dpi. (A) Jejunal tissue from piglets fed with Znlow, Znmed, and Znhigh diets, respectively, were sliced and H&E stained. The bottom and upper dashed lines indicate the basal and apical borders of the epithelium. The middle dashed line represents the transition zone from where crypts go down and villi go up. TGEV infection in Znlow piglets resulted in villus atrophy, which could be prevented by Znmed and Znhigh diets. Scale bar = 200 μm. (B) H&E-stained jejunal specimens were morphometrically analyzed by measuring the lengths of apical epithelial and the mucosa’s muscular linings. The ratio of mucosal-to-serosal surface area represents a measurement for the effective epithelial area, which was significantly decreased under Znlow (P ≤ 0.01, n =6) compared to Znmed and Znhigh (n = 6 each). The latter conditions were not significantly different.
