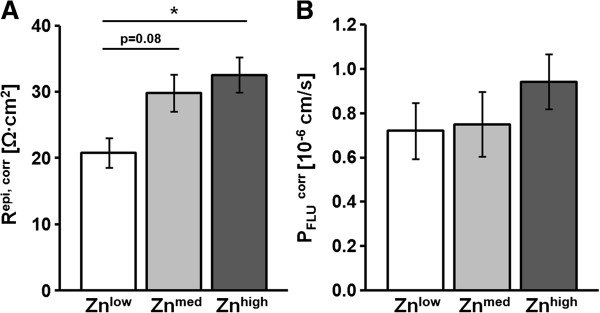
Figure 6.

Epithelial resistance and paracellular permeability at 1 dpi. All values were corrected for the epithelial surface area (corr). (A) Epithelia from the Znlow group exhibited significantly decreased Repi, corr values (P = 0.01, n = 8) compared to the Znhigh group (n = 10) and a trend to values lower than those of the Znmed group (P = 0.08, n = 10). (B) Fluorescein permeability (PFLUcorr) did not significantly differ between Zn groups.
