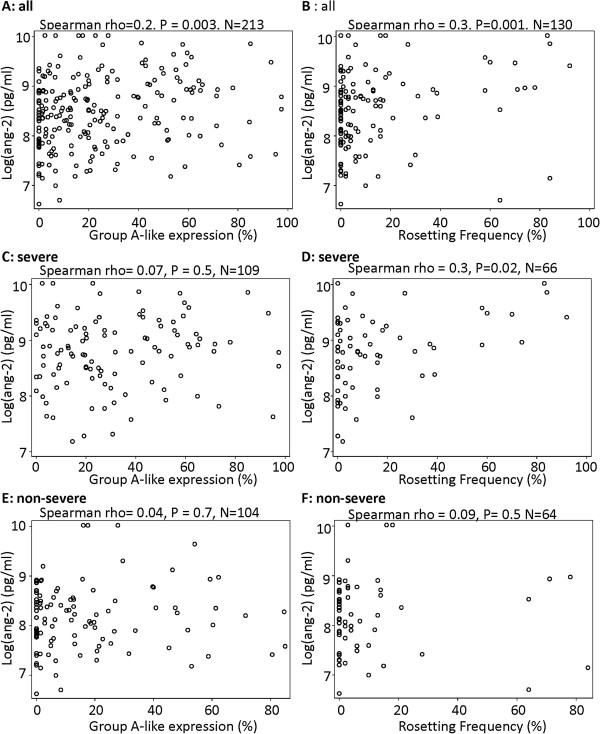
Figure 2.
The relationship between ang-2 and group A-like expression and the rosetting phenotype of the infecting parasite. Scatter plots showing the relationship between A) ang-2 and group A-like expression, B) ang-2 and rosetting frequency for all the samples. C & D and E & F are repeats of A and B analysis within severe and non-severe cases respectively.

