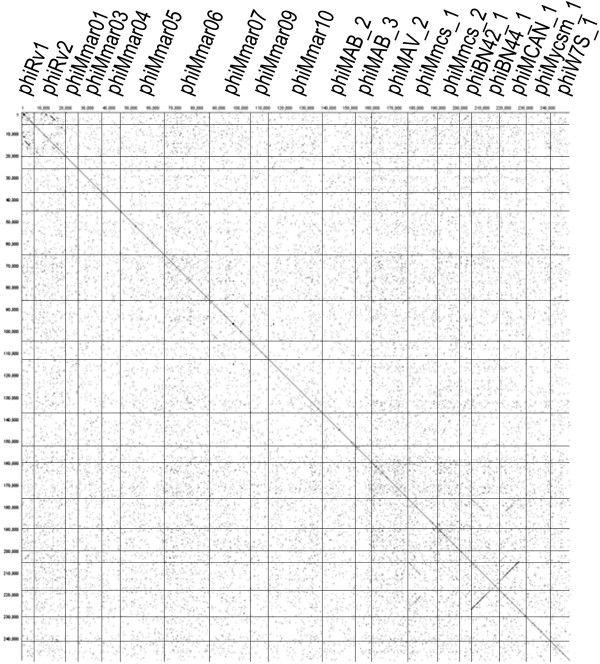
Figure 3.

Comparative genomic analyses of prophage-like sequences. Dot plot matrix calculated for the complete genomes of all prophage-like sequences in Mycobacterium. The top x axis and the left y axis provide a scale in kilobases; and the top x axis identifies the prophage genomes that are compared in the corresponding square. The x and y axes are the identical sequences. The slash means that two DNA fragments are homologous to each other. The backslash means that one DNA fragment is homologous with the reverse sequence of other DNA fragment. The word length used is 12 bp.
