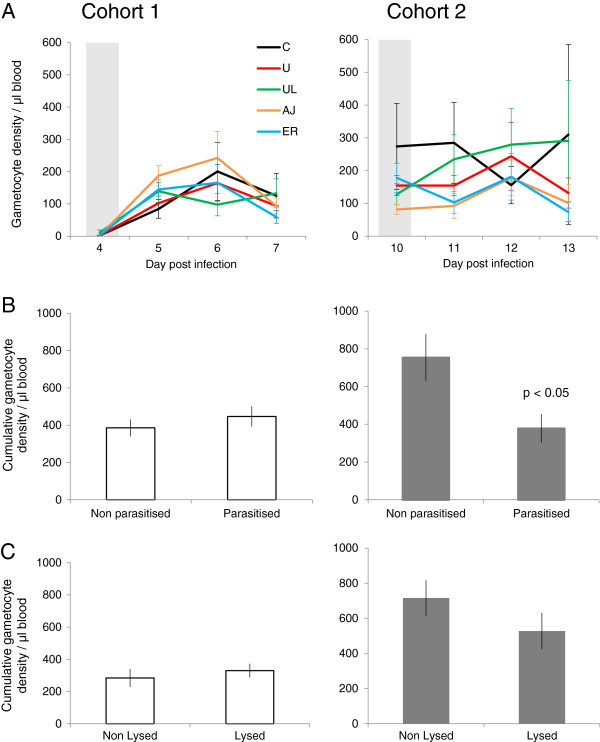
Figure 1.
Plasmodium chabaudi AJ gametocyte density dynamics. (± SEM) from the day of administration of five cue treatments: C: control, U: uninfected RBCs, UL: uninfected lysed RBCs, AJ: AJ infected lysed RBCs and ER: ER infected lysed RBCs). Grey bars indicate the days when cues were administered - on day 4 PI for cohort 1 (left) and day 10 PI for cohort 2 (right) (A); cumulative gametocyte densities (± SEM) for three days post treatment with cues containing parasitized material (P: AJ, ER) or non-parasitized material (NP: C, U, UL) for cohort 1 (left) and for cohort 2 (right: where gametocyte density was significantly lower in the P group than NP group) (B); cumulative gametocyte densities (± SEM) for three days post treatment with either lysed RBC material (L: UL, AJ, ER) or non-lysed material (NL: C, U) for cohort 1 (left) and cohort 2 (right) (C).

