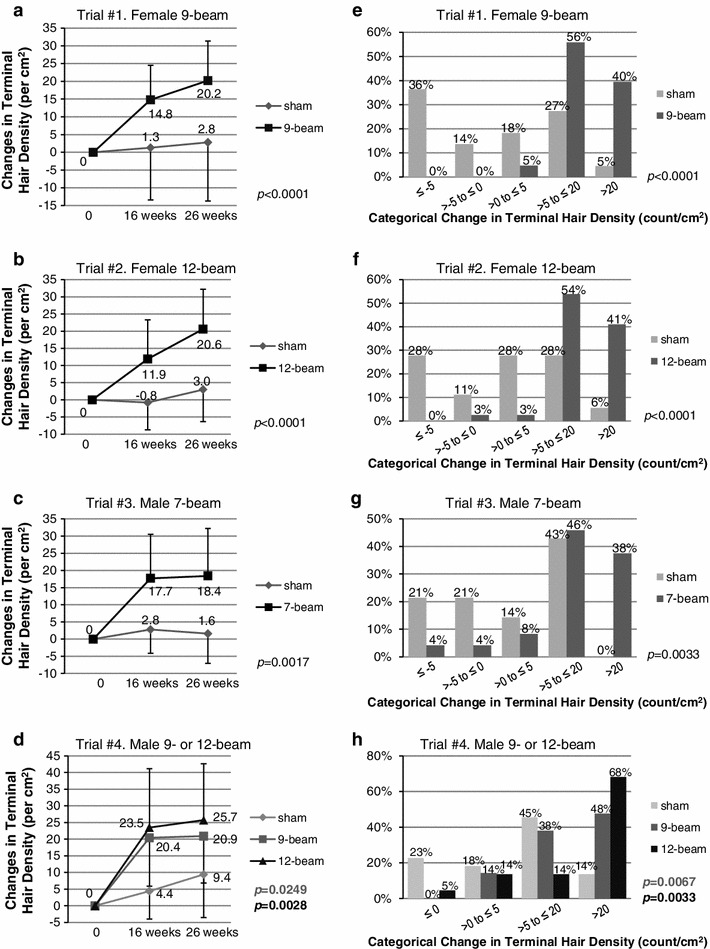
Fig. 2.

a–d Mean changes in terminal hair density (count per cm2) from baseline in subjects treated with the lasercomb or sham device. Bars indicate standard deviation. e–h Categorical changes in terminal hair density (count per cm2) from baseline to 26 weeks in subjects treated with the lasercomb or sham device. Shown are p values at 26 weeks
