Figure 3.
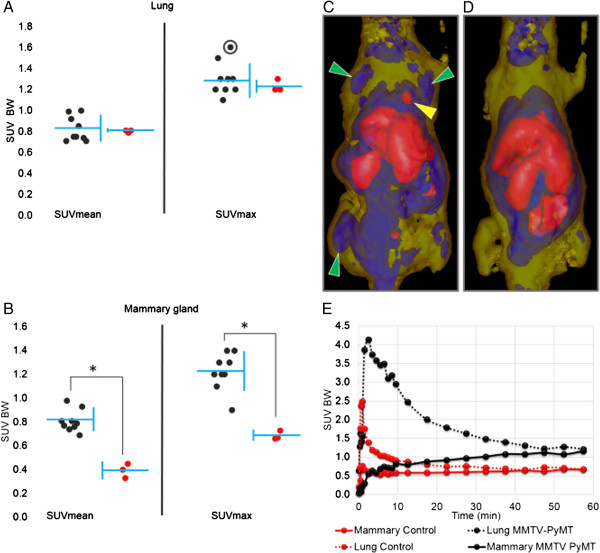
Uptake in mammary glands and lung in MMTV-PyMT mice. (A) Lung and (B) mammary gland uptake after injection of (R)-[11C]PAQ described as SUVmean and SUVmax values. SUV values for MMTV-PyMT mice in black (n = 9) and WT in red (n = 3). All SUV values are calculated in relation to body weight (BW) from data summed from 20 to 60 min after i.v. administration of (R)-[11C]PAQ. Each individual is represented by a single dot; mean value and standard deviation of each group are indicated by the horizontal and vertical blue lines, respectively. Asterisk indicates a significant difference (unpaired t test, p < 0.005). (C) PET image of the MMTV-PyMT mouse (12 weeks) with highest SUVmax value in the lung; indicated with a circle in (A). (D) WT control mouse (13 weeks). The images are transparent isosurfaces with SUV > 1.5 = red colour, 0.7 < SUV < 1.4 = blue and 0.1 < SUV < 0.6 = yellow. Image data are collected for 60 min, starting at injection of (R)-[11C]PAQ. Green arrows indicate cancerous mammary glands, and the yellow arrow indicates an abnormal lung uptake. (E) TACs for lung and mammary gland tissue of the mice in (C) and (D), respectively. TACs are derived from volume-standardized ROIs drawn over the area with highest uptake in each respective tissue of the mouse in (C) and the corresponding tissue of the mouse in (D).

