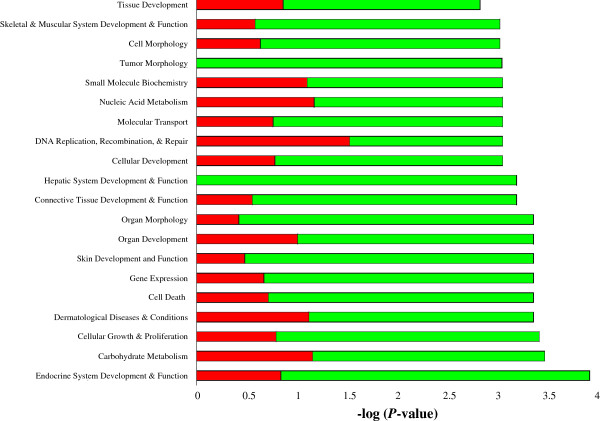
Figure 2.

Classification of DEG according to top 20 molecular and cellular functions, most significantly affected by endometrial related sub-fertility, using IPA. The red/green bars indicate the likelihood [−log (P-value)] that the specific molecular and cellular function category was affected by endometrial related sub-fertility compared with others represented in the list of DEG. The proportion of up- and down-regulated genes in each group is represented by the red and green segments on each bar, respectively.
