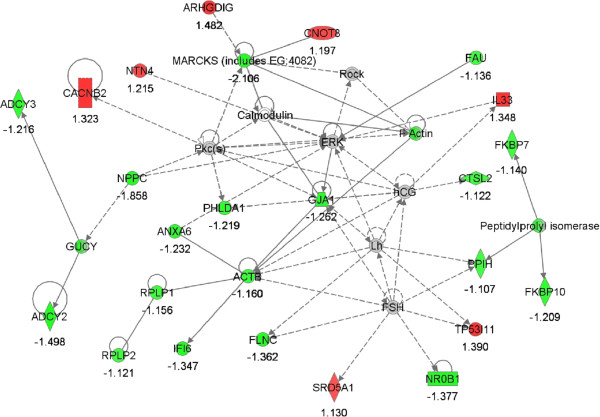
Figure 3.

Network #1; lipid metabolism, small molecule biochemistry. The network is displayed graphically as nodes (genes). The node color intensity indicates the expression of genes; with red representing up-regulation and green, down-regulation in LF versus HF endometrium. The fold value is indicated under each node.
