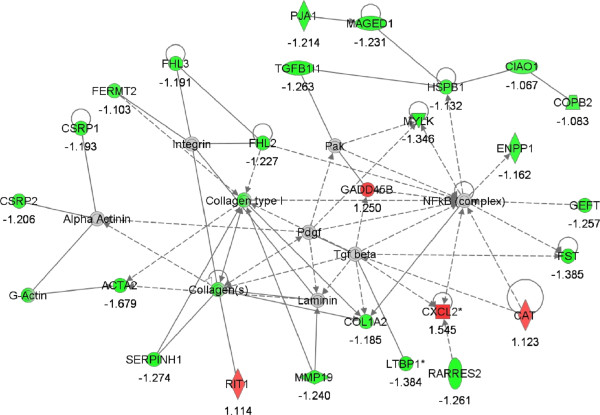
Figure 4.

Network #2; cellular growth and proliferation, connective tissue development and function, skeletal and muscular system development and function. The network is displayed graphically as nodes (genes). The node color intensity indicates the expression of genes; with red representing up-regulation and green, down-regulation in LF versus HF endometrium. The fold value is indicated under each node.
