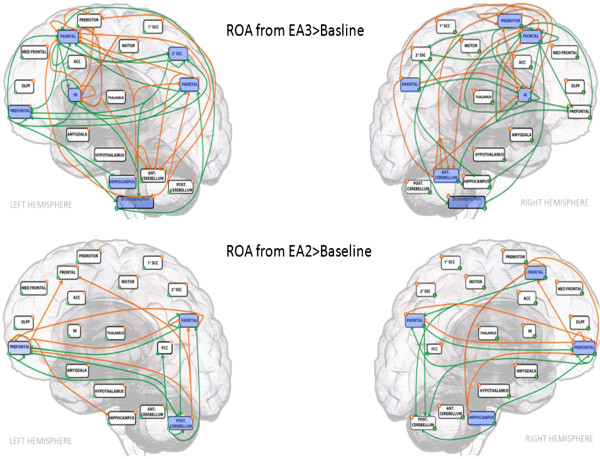
Figure 3.
Comparison of Granger Causality Analysis inference among regions of activities (ROA) extracted from EA3>Baseline and EA2>Baseline. Blue box color indicates deactivation; Green arrow signifies inference originating from the left hemisphere, whereas orange arrow signifies inference originating from the right hemisphere; 1°SCC; Primary Somatosensory Cortex; 2°SCC: Secondary Somatosensory Cortex; ACC: Anterior Cingulate Cortex; PCC: Posterior Cingulate Cortex; DLPFC: Dorsolateral Prefrontal Cortex; IN: Insular Cortex; Med: Medial; Ant: Anterior; Post: Posterior.

