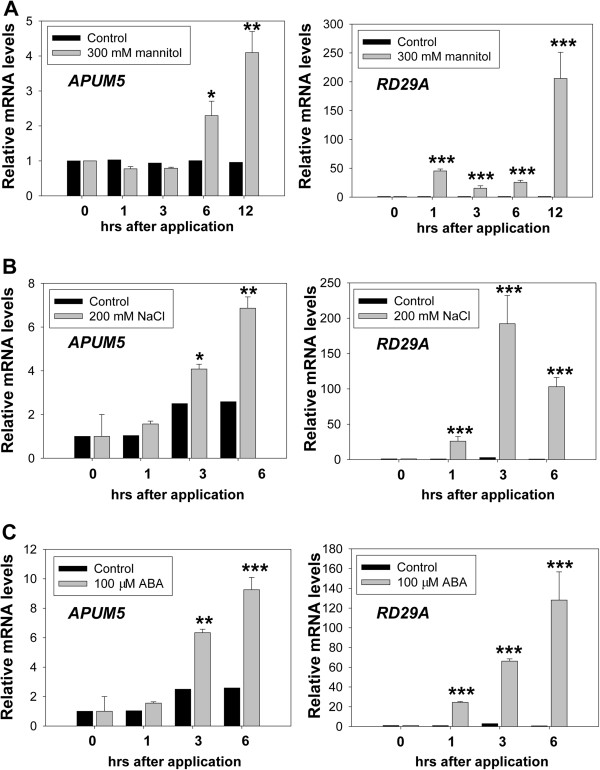
Figure 2.
Expression analysis of APUM5 by qRT-PCR following osmotic stress, salt, and ABA treatments. (A) Expression patterns of APUM5 and RD29A in response to mannitol treatment. (B) Expression patterns of APUM5 and RD29A in response to salt treatment. (C) Transcription levels of APUM5 and RD29A following ABA treatment. Expression patterns of RD29A were used as a positive control for the mannitol, NaCl, and ABA treatments. APUM5 and RD29A transcription levels in 10-day-old wild-type Arabidopsis seedlings grown on 1/2 MS medium containing 1.5% sucrose and treated without (control) or with 300 mM mannitol, 200 mM NaCl, or 100 μM ABA were analyzed by qRT-PCR. Error bars indicate standard deviations (n = 3). (Student’s t-test; *P < 0.01, **P < 0.001, ***P < 0.0001).

