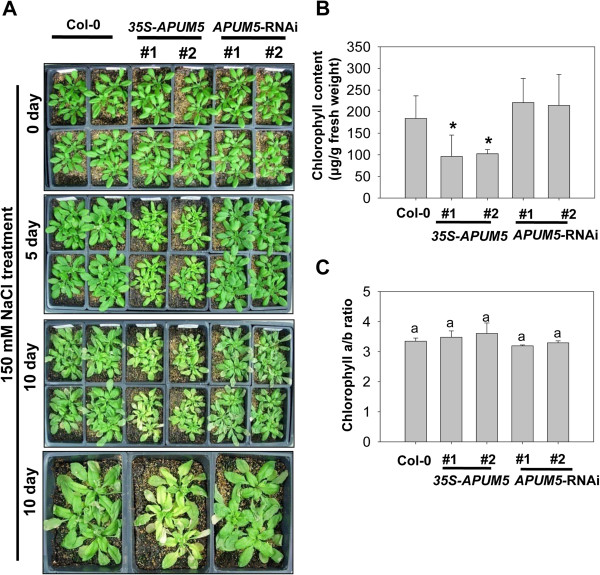
Figure 5.
Analysis of salt sensitivity in wild type and APUM5 transgenic plants in soil. (A) Photographs show plants treated with 150 mM NaCl at the indicated time points. Four-week-old Col-0, 35S-APUM5, and APUM5-RNAi plants were treated with 150 mM NaCl. (B) Chlorophyll contents of salt-treated plants on day 10. Pigments were extracted from the salt-treated plant leaves. Data are mean values of six independent experiments. (C) Chlorophyll a/b ratio of salt-treated plant leaves. Error bars represent ± SD (Student’s t-test; *P < 0.01).

