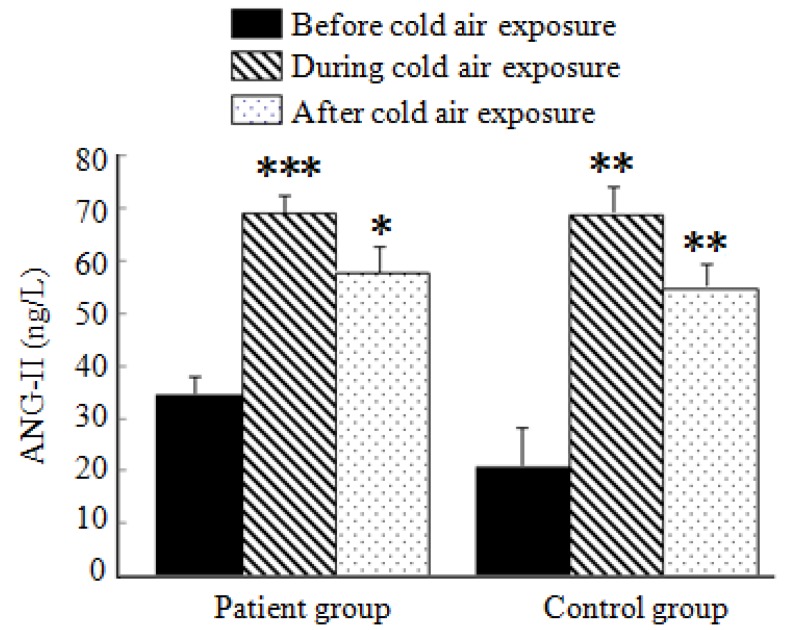
Figure 4.
Average ANG-II levels in the patient and control groups during a cold air event.
Notes: *** compared with the indicators before the cold air exposure, p < 0.001; ** compared with the indicators before the cold air exposure, p < 0.001; * compared with the indicators before the cold air exposure, p < 0.005; ANG-II: angiotensin. Error bars: standard deviation.

