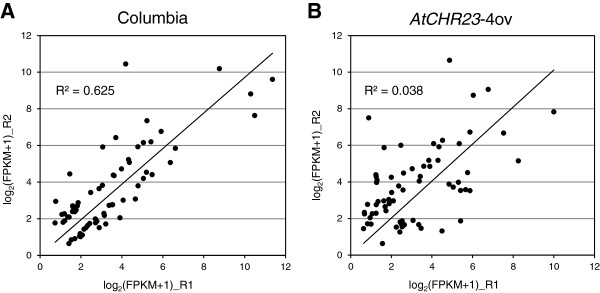
Figure 9.

Over-expression of AtCHR23 pronounces the variation in genes that are already variable in the wild-type. The panels show scatter plots and the linear regression line of the gene expression expressed as log2(FPKM + 1) of the 68 genes identified as variable of the two biological replicates of (A) the wild-type (Columbia) and (B) the AtCHR23-4ov over-expressing line, both grown in long-day conditions. The coefficient of determination (R2) is shown in the panel. R1, biological replicate 1; R2, biological replicate 2.
