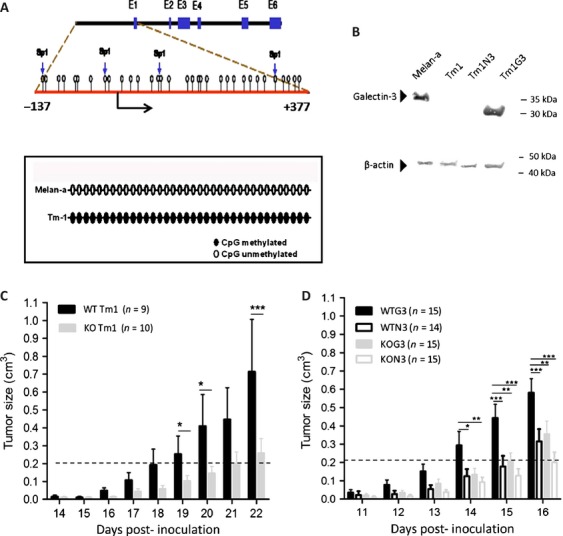
Figure 1.

Methylation status of galectin-3 promoter region in melan-A and Tm1 cells. (A) Sequence of promoter, first exon and first intron (from −137 upstream to +377 downstream) of the galectin-3 gene (GenBank, # L08649). The analysis of these regions using CpGplot indicated that these regions lie within a putative CpG island. CpG dinucleotides methylated are represented as black circles whereas unmethylated CpG dinucleotides are represented in open circles. (B) Western blotting to galectin-3 in melan-A, Tm1 and transfected cells with a plasmid containing human cDNA for galectin-3 or the empty vector (Tm1G3 and Tm1N3) showing the presence of the murine galectin-3 in melan-A (molecular weight, ∼30 kDa), and the human galectin-3 in Tm1G3 (molecular weight, ∼25 kDa). Each lane corresponded to 20 μg from total protein cell extracts. (C) Representative graph of tumor volume after Tm1-galectin-3-nonexpressing cells implantation in C57black/6 Lgals3+/+ (WT) or Lgal3s3−/− (KO) mice. After 14 days post inoculation a palpable mass was detected. (D) After Tm1G3 injections in WT mice (WTG3) or KO mice (KOG3) a palpable mass was detected after 11 days post inoculation. The dashed line represents the cutoff tumoral volume to compare inocula of Tm1 and its transfected cells. The results in each graph corresponded to mean ± SEM and test used was two-way ANOVA with post test comparing all pair of columns. WT, wild type; KO, knockout; ANOVA, analyses of variance.
